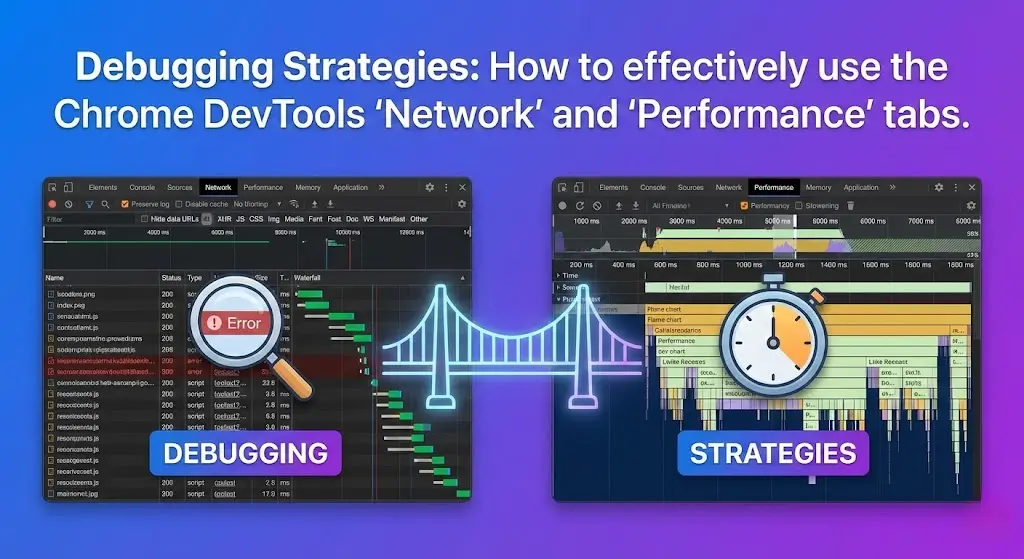
A report appears noticeably late after you click Load. Is the API slow, is the browser busy, or is rendering delayed? The total time the user waits does not answer that question. Chrome DevTools can separate those causes, but only if you read the Network and Performance panels as complementary evidence.
The Network panel explains request discovery, dependencies, transfer, and response timing. The Performance panel shows what the browser was doing before, during, and after those requests. This guide works through one reproducible example, then applies the same reasoning to real pages.
First, choose the recording that answers your question
| Symptom | Start here | What to inspect next |
|---|---|---|
| Initial page load is slow | Network, then Performance load recording | HTML response, critical resource chain, LCP event, main-thread work |
| An API-driven view takes too long to update | Network request Timing, then Performance runtime recording | Response arrival versus parsing, JavaScript, layout, and paint |
| Clicking or typing feels unresponsive | Performance runtime recording | Interactions track, input delay, event processing, presentation delay |
| Some requests work on refresh but not navigation | Network with Preserve log | Initiator chain, redirects, cookies, request headers, and failures |
| An element visibly jumps | Performance layout shifts | Affected element and the preceding DOM, font, or image change |
Before recording, state the actual symptom: "The report text appears late after clicking Load," rather than "the page is slow." This prevents you from optimizing whichever number looks largest.
For a page-load investigation, open Network before reloading. Keep recording enabled. Turn on Preserve log only if you need requests across navigations. Use Disable cache for a deliberate cold-cache comparison, not as a permanent setting: it changes the behavior you are measuring, and it applies while DevTools is open. Record a separate warm-cache run if repeat visits matter. Chrome documents these controls in its Network panel overview.
For interactive slowness, open Performance and choose Record, perform the action, then stop. Record and reload is a different experiment designed for page loading. Chrome distinguishes these capture modes in its Performance reference.
A small lab with two different delays
This complete, dependency-free lab uses only Node.js built-in modules. Save it as server.mjs, run node server.mjs with Node.js 18 or later, and open http://127.0.0.1:4173 in Chrome. It is a local diagnostic exercise, not a production benchmark. You can copy the entire file below; no separate repository link is required.
The app has one button, one checkbox, and a single API route:
- Server wait:
/api/reportdeliberately waits about 350 ms before returning a small JSON response. The number is a configured delay, not a measured backend service time. - Client work: When Add blocking CPU work is checked, the browser executes a roughly 180 ms busy loop after reading the JSON body. It is intentionally bad application code used to make the main-thread problem visible.
- Comparison: Uncheck the option and repeat. The server still waits, but the post-response CPU work is removed.
The complete runnable server and browser interaction are:
import http from 'node:http';
import { pathToFileURL } from 'node:url';

const page = String.raw`<!doctype html>
<html lang="en">
<head>
  <meta charset="utf-8">
  <meta name="viewport" content="width=device-width, initial-scale=1">
  <title>DevTools latency lab</title>
  <style>
    body { max-width: 44rem; margin: 3rem auto; padding: 0 1rem; font: 1rem/1.5 system-ui; }
    button, label { display: inline-block; margin: 0.75rem 0.75rem 0.75rem 0; }
  </style>
</head>
<body>
  <h1>DevTools latency lab</h1>
  <label><input id="cpu" type="checkbox" checked> Add blocking CPU work</label>
  <button id="load" type="button">Load report</button>
  <p id="status" role="status">Ready</p>
  <script>
    const cpu = document.querySelector('#cpu');
    const button = document.querySelector('#load');
    const status = document.querySelector('#status');

    function blockMainThread() {
      const until = performance.now() + 180;
      while (performance.now() < until) { /* diagnostic busy loop */ }
    }

    button.addEventListener('click', async () => {
      button.disabled = true;
      status.textContent = 'Loading';
      performance.mark('request-start');
      try {
        const response = await fetch('/api/report', { cache: 'no-store' });
        if (!response.ok) throw new Error('HTTP ' + response.status);
        const report = await response.json();
        performance.mark('body-read');
        performance.measure('request-and-parse', 'request-start', 'body-read');
        if (cpu.checked) blockMainThread();
        performance.mark('work-end');
        performance.measure('post-response-work', 'body-read', 'work-end');
        status.textContent = 'Received ' + report.count + ' records';
      } catch (error) {
        status.textContent = 'Failed: ' + error.message;
      } finally {
        button.disabled = false;
      }
    });
  </script>
</body>
</html>`;

export function createServer() {
  return http.createServer(async (request, response) => {
    if (request.method === 'GET' && request.url === '/') {
      response.writeHead(200, { 'Content-Type': 'text/html; charset=utf-8', 'Cache-Control': 'no-store' });
      response.end(page);
      return;
    }
    if (request.method === 'GET' && request.url === '/api/report') {
      await new Promise(resolve => setTimeout(resolve, 350));
      response.writeHead(200, { 'Content-Type': 'application/json', 'Cache-Control': 'no-store' });
      response.end(JSON.stringify({ count: 1200 }));
      return;
    }
    response.writeHead(404, { 'Content-Type': 'text/plain' });
    response.end('Not found');
  });
}

if (process.argv[1] && import.meta.url === pathToFileURL(process.argv[1]).href) {
  createServer().listen(4173, '127.0.0.1', () => {
    console.log('Open http://127.0.0.1:4173');
  });
}
The two named measurements serve different purposes. The measure names are deliberate:
request-and-parseincludes the asynchronous wait, transfer, and JSON consumption. It does not isolate the backend.post-response-workmeasures synchronous JavaScript between the body-read and work-end marks. It stops before the DOM update and does not include the next paint.- The busy loop blocks the browser's main thread; the
await fetch(...)wait does not itself occupy the main thread continuously.
The User Timing API makes these marks and measures available for correlation with a Performance recording. It is useful precisely because a long wall-clock interval and a long CPU task are not interchangeable.
Read the Network request without guessing at its cause
Open Network, clear the previous entries, click Load report, and select the /api/report request. In the Headers tab, confirm its URL, method, status, and cache behavior. The Payload and Response tabs are useful for API failures, but response correctness alone says nothing about whether rendering was delayed.
Then open Timing. The request's overall duration is divided into phases. Not every phase appears for every connection:
| Network timing phase | What it means | What not to conclude |
|---|---|---|
| Queueing or Stalled | The request waited for browser scheduling or a connection/resource opportunity | It is not automatically a slow server |
| DNS, Initial connection, SSL | Name resolution and connection setup where applicable | These may be absent on reused connections |
| Waiting (TTFB) | From sending the request to receiving the first response byte, including network round trip and server response preparation | TTFB does not identify a database query by itself |
| Content Download | Receiving or reading the response body | A long duration is not proof that the asset is oversized |
Chrome's Network timing reference defines these phases, including the fact that connection limits described for HTTP/1.1 do not simply transfer to HTTP/2 or HTTP/3.
In this lab, the Waiting (TTFB) portion should be prominent because the server intentionally delays the response. Its exact displayed duration varies with scheduling, loopback overhead, browser version, and instrumentation. There is no meaningful DNS comparison here because the request targets a local address.
Waterfalls show ordering, not causality on their own
Sort the Waterfall to inspect which resources started late and which finished late. A staircase of requests can indicate a dependency chain, but it may also reflect intentional sequencing. Hover an entry or open its Initiator tab to discover what triggered it. Ask whether an earlier script, stylesheet, redirect, or response had to complete before the later request could start.
A request that starts early and spends time downloading requires a different fix from a request that is not discovered until late. Moving bytes or turning on compression will not automatically solve a late-discovery dependency. Chrome's network request dependency tools help trace initiators; the Performance Insights catalog identifies related page-load analyses.
For real sites, inspect Size, Priority, Initiator, cache status, response headers, and whether a service worker served the request before diagnosing an issue as "the network." When collecting evidence, note whether you used DevTools throttling and whether the request was cached.
Find the work the Network panel cannot explain
Leave the CPU checkbox checked. Open Performance, select Record, click Load report once, allow the report to appear, and stop the recording. Navigate to the same action in the trace.
Follow this order:
- Find the
/api/reportentry in the Network track. The request can be waiting while the main thread is free for other work. - Locate the
request-and-parseandpost-response-workUser Timing entries. If their track is not visible, inspect the track settings. The marks provide source-level boundaries, but they do not replace the browser's own events. - In the Main track, inspect the work after the response is consumed. Expand the JavaScript call stack to find
blockMainThread, if the sampling data includes it. - Select the range and inspect Bottom-up or Call tree. Compare Self time with Total time before deciding whether the selected function itself is expensive or merely calls expensive work.
- Look at the screenshots or rendered output to check when the result becomes visible. A User Timing mark before a DOM mutation is not a paint timestamp.
This is why the same click can have both a slow request and an expensive JavaScript segment. The Network panel shows the request, but it does not show how much synchronous work the application performs once the body has been parsed. The Performance reference explains Main-thread activities, the flame chart, and tabular views.
A broad yellow scripting region indicates JavaScript activity, not automatically an unnecessary React render. A purple Layout event is not automatically "layout thrashing." Forced reflow requires more specific evidence, such as geometry reads after invalidating writes; Chrome offers a dedicated Forced reflow insight. First find the originating code and the repeated pattern, then consider batching DOM reads and writes.
Why this demo does not establish a poor INP
A click handler that changes the status to "Loading" and then awaits a request may allow a frame to paint before the response returns. The eventual 180 ms busy loop happens in a later asynchronous continuation. It can delay the final result and other input, but it is not correct to label the entire request-to-result time as Interaction to Next Paint (INP) for the initial click.
INP concerns responsiveness to user interactions and is analyzed through input delay, processing duration, and presentation delay. A long main-thread task can make an interaction that arrives during that task wait longer to be handled. To diagnose that symptom, record the actual slow interaction and inspect its Interactions track and breakdown, following web.dev's lab diagnosis guide.
Similarly, a Network load event is not Largest Contentful Paint (LCP). Use the Performance panel's live metrics and load trace to identify LCP or layout shifts rather than substituting network milestones for user-visible results. For the browser's separate style, layout, paint, and compositing stages, see how browsers render a page.
Change one cause and rerun the same action
Uncheck Add blocking CPU work, clear the current recording, and capture the click again. Keep the browser, viewport, throttling, and cache configuration unchanged. The API's configured delay is identical in both variants; the intentional busy loop is the only toggled behavior.
Compare these observations, not a single headline score:
| Evidence | With CPU work | Without CPU work |
|---|---|---|
| Network request | Delayed local JSON response | Same server behavior, subject to normal variance |
request-and-parse | Contains the request wait and parsing | Contains the request wait and parsing |
post-response-work | Includes the deliberate busy loop | Contains only short handler work |
| Main track after body read | Expect a conspicuous synchronous task | That deliberate task is absent |
| Final report text | Updated after the busy loop | Updated soon after the body is read |
Run each case multiple times if comparing durations. Record actual values and variance before claiming a speedup. Development builds, source maps, extensions, background tabs, CPU frequency changes, profiling overhead, and cache state can distort results. The lab isolates the type of delay, not a representative production device.
CPU throttling is useful for exposing a problem, but Chrome explicitly warns that throttling is relative to the computer capturing the trace. A 4x slowdown does not make a laptop behave exactly like any particular phone. The Performance reference also documents calibrated presets and recording settings.
A practical diagnosis checklist
Once you have reproduced a real slowdown, use the evidence to choose the next action:
- Long TTFB: Check server timings and backend traces, request waterfalls, redirects, and network conditions. Separate origin processing from transport latency before changing application code.
- Late request start: Inspect initiators, sequential data fetching, script execution, and resource discovery. Do not assume transferring fewer bytes fixes dependency ordering.
- Long content download: Compare transferred and decoded sizes, compression, image dimensions, cache behavior, and the connection under test.
- Long JavaScript task after response: Attribute the task to a call stack. Reduce work, break up long tasks, or consider a worker for suitable computation, then remeasure correctness and responsiveness.
- Rendering after data arrives: Inspect style recalculation, layout, painting, and layout shifts. A fast API does not imply fast visual feedback.
- Slow user input: Measure the actual interaction, not only asynchronous data completion. Identify whether input delay, processing, or presentation dominates.
DevTools is a local experiment. Its Performance panel can also display Chrome UX Report field metrics where available; those come from real-user samples, with a different collection window and population from your trace. Avoid treating one local recording as proof about all visitors. A Lighthouse score is also not a substitute for a reproducible diagnosis; see why Lighthouse scores can mislead.
Finally, be careful when sharing captures. Even a sanitized HAR can expose URLs, response information, or business-sensitive traffic. Chrome's HAR export controls exclude certain sensitive headers by default, but you should still inspect exported files and performance traces before distributing them.
The useful outcome is not a prettier flame chart. It is a falsifiable explanation: what waited, what ran, what painted, and which change removed the observed delay.